My first experience with the Vampir trace visualiser was in 2010 during my studies at EPCC. While working on the exercises and samples, I was excited by the possibility of finding out what every process or thread (from thousands) is doing at any point in time. Over the years I have used TAU + Score-P + Vampir toolset with different applications on various systems. When it comes to trace visualisation for scientific applications at scale, Vampir is very impressive. If you haven't used it before, give a try!
One of the missing piece in profiling toolset (in my opinion) is an open source alternative for OTF2 trace visualisation. In the past I tried converting TAU traces to SLOG2 format (using tau2slog2) to be visualized with Jumpshot or EPILOG traces to the Paraver format (using elg2prv) to be visualised with PARAVER. I don't remember having fond memories of being very successful in those attempts. Obviously one can try different profiler like HPCToolkit with hpctraceviewer, Extrae with Paraver or Intel Trace Analyzer and Collector, which has their own trace formats, but let's talk about that in separate post.
Few years ago one of the colleague from Jülich Supercomputing Centre showed me the demo of Blade plugin to explore the OTF2 traces (see Additional Cube Plugins section here). I was excited to see open source tool for visualising OTF2 traces. It was released last year but didn't get chance to explore all details. This post summarises use of this new plugin with Cube.
Sample Application
While exploring new tool I often find helpful to have a toy example that one can easily map to the profiling or trace data. Here is an execution workflow of simple program that we are going to use:
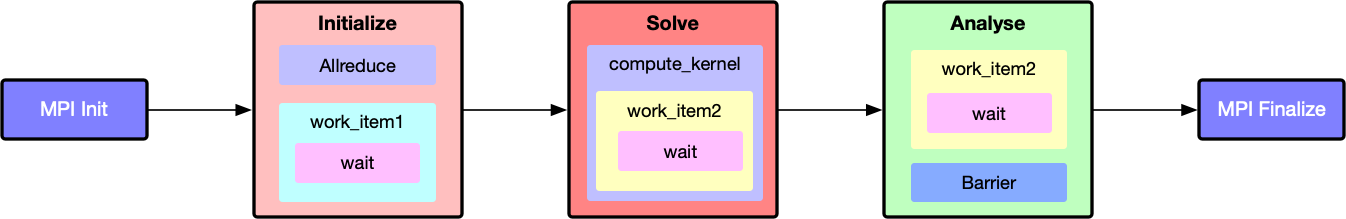
Just to have call-chain in the trace data, we have scattered functions and MPI calls in the toy application. The code is very simple and here is full listing:
|
1 2 3 4 5 6 7 8 9 10 11 12 13 14 15 16 17 18 19 20 21 22 23 24 25 26 27 28 29 30 31 32 33 34 35 36 37 38 39 40 41 42 43 44 45 46 47 48 49 50 51 52 53 54 55 56 57 58 59 60 61 62 63 64 65 66 67 68 69 70 71 72 73 74 |
#include <mpi.h> #include <unistd.h> /// number of usecs to wait const int INIT_USEC = 3000000; const int WORK_USEC = 100000; /// toy class to wrap routines class Problem { private: int rank = 0; int size = 0; void wait(double sec); void work_item1(); void work_item2(); void compute_kernel(); public: Problem(); void initialize(); void solve(); void analyse(); }; void Problem::wait(double usec) { usleep(usec); } Problem::Problem() { MPI_Comm_rank(MPI_COMM_WORLD, &rank); MPI_Comm_size(MPI_COMM_WORLD, &size); wait(INIT_USEC); } /// initialize routines: different ranks wait for different duration void Problem::work_item1() { wait(rank * WORK_USEC); } void Problem::initialize() { double local = 0; double value = 0; for (int i = 0; i < 5; i++) { MPI_Allreduce(&local, &value, 1, MPI_DOUBLE, MPI_SUM, MPI_COMM_WORLD); work_item1(); } } /// main solver routines void Problem::compute_kernel() { for (int i = 0; i < 5; i++) { work_item2(); } } void Problem::solve() { compute_kernel(); } /// analysis routines: last half ranks just wait in barrier void Problem::work_item2() { wait(WORK_USEC); } void Problem::analyse() { if (rank <= (size / 2)) { for (int i = 0; i < 5; i++) { work_item2(); } } MPI_Barrier(MPI_COMM_WORLD); } /// sample app int main(int argc, char *argv[]) { MPI_Init(&argc, &argv); Problem p; p.initialize(); p.solve(); p.analyse(); MPI_Finalize(); } |
Instrumentation and Measurement
We will use Score-P for instrumentation and generating traces. Assuming you have working Score-P installation, compile sample application with compiler instrumentation as :
|
1 2 3 |
scorep --compiler mpicxx -std=c++11 sample.cpp -o sample |
Now executable is ready for profile measurement. We will set following environmental variables to enable tracing and set result directory name to scorep-trace :
|
1 2 3 4 |
export SCOREP_ENABLE_TRACING=true export SCOREP_EXPERIMENT_DIRECTORY=scorep-trace |
Let's run application with 16 MPI processess as:
|
1 2 3 |
mpirun -n 16 ./sample |
This should generate scorep-trace directory with profile as well as trace data:
|
1 2 3 4 5 6 7 8 9 10 11 12 |
$ tree scorep-trace/ scorep-trace/ ├── profile.cubex ├── scorep.cfg ├── traces │ ├── 0.def │ ├── 0.evt │ ├── 1.def │ ├── 1.evt ... |
This trace is very small and you can dowload it here.
Cube with Blade Plugin
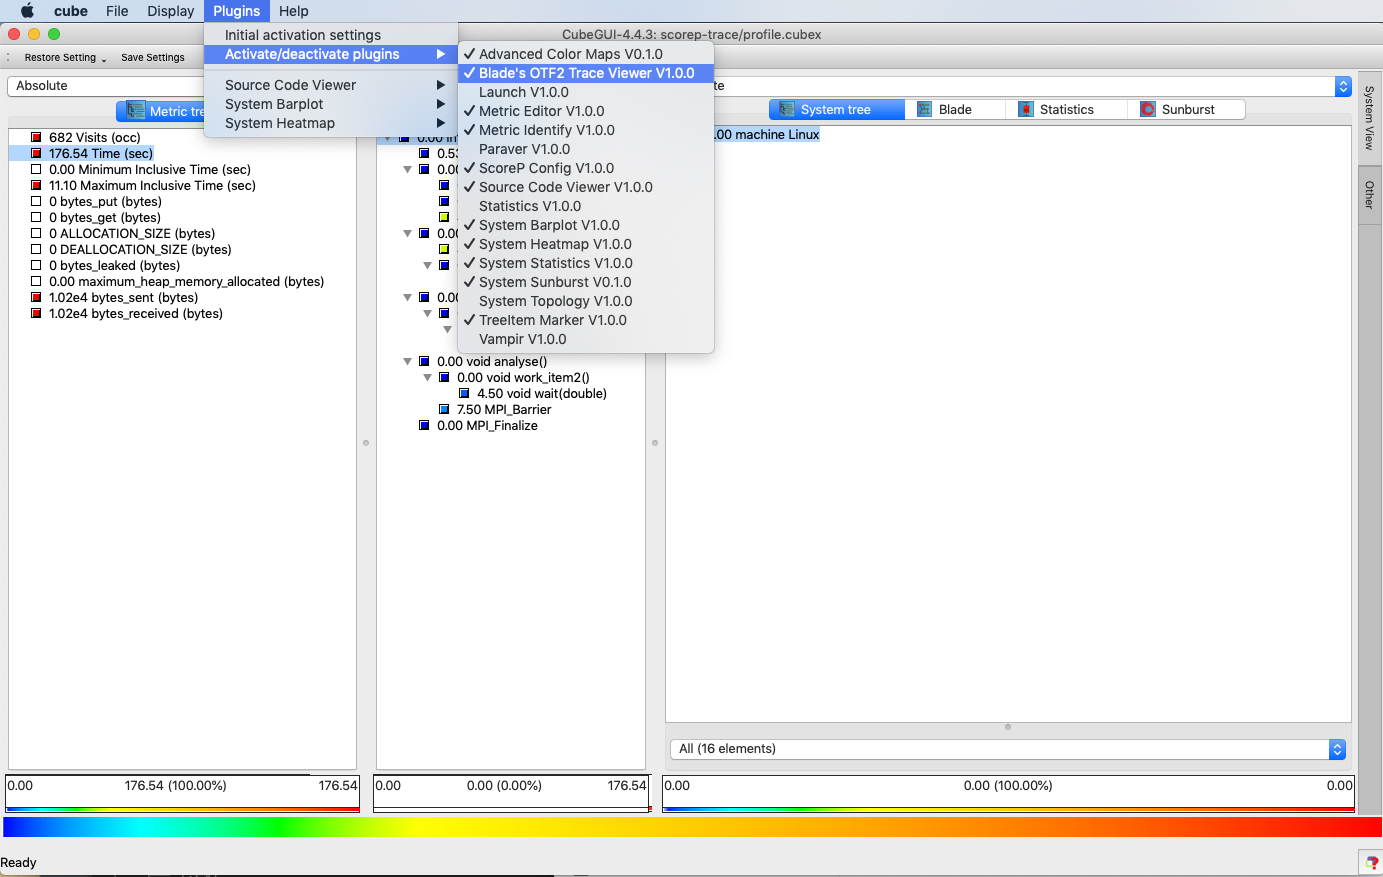
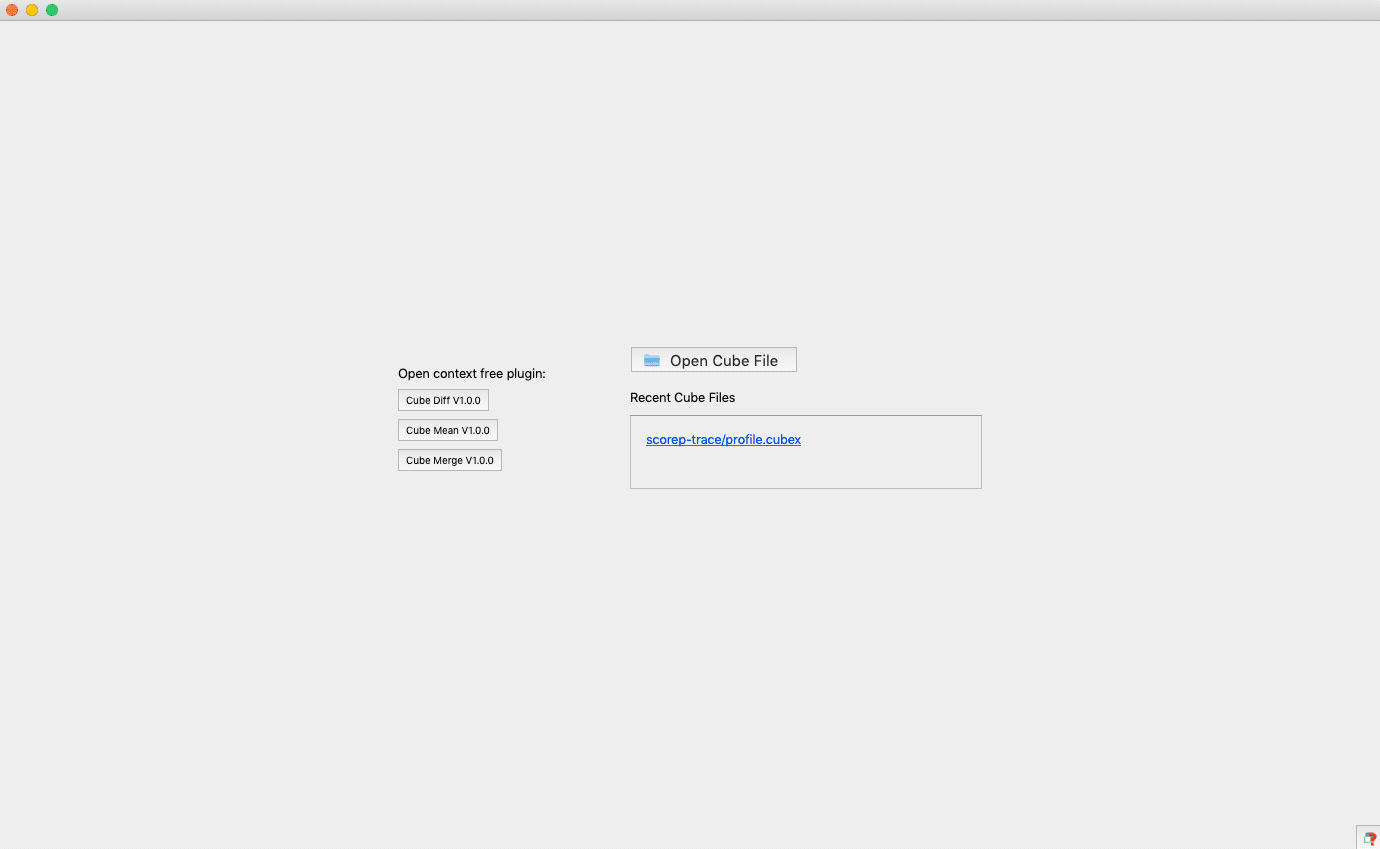
CUBE is a performance data explorer designed for interactive exploration of performance data. With it's plugin architecture, one can develop new tools and integrate with Cube (see Cube Plugins Developer guide). In addition to CubeGUI we need to separately install Blade plugin (See Installation instructions on project page). I have seen minor build issues while building current release bladeplugin-0.1 (here is a small patch reported to developers). Assuming Cube and Blade plugin is installed correctly, Blade plugin should appear in the Activate/deactivate plugins option as shown below:
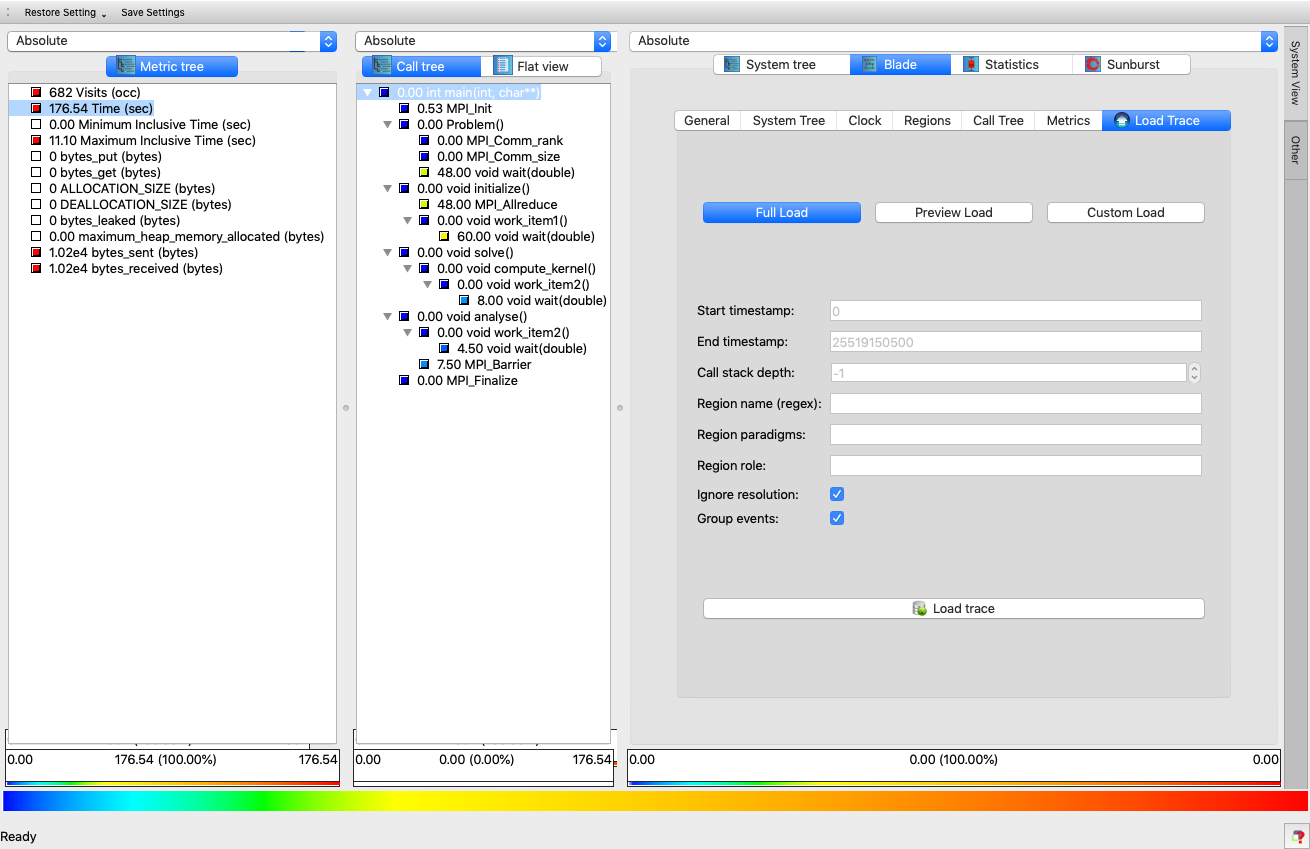
If you have used Cube before, profile explorer interface with Metric-Call-System pane should be familiar to you. If we select Blade plugin in the System Pane, we can use Load Trace option to import corresponding OTF2 trace as:
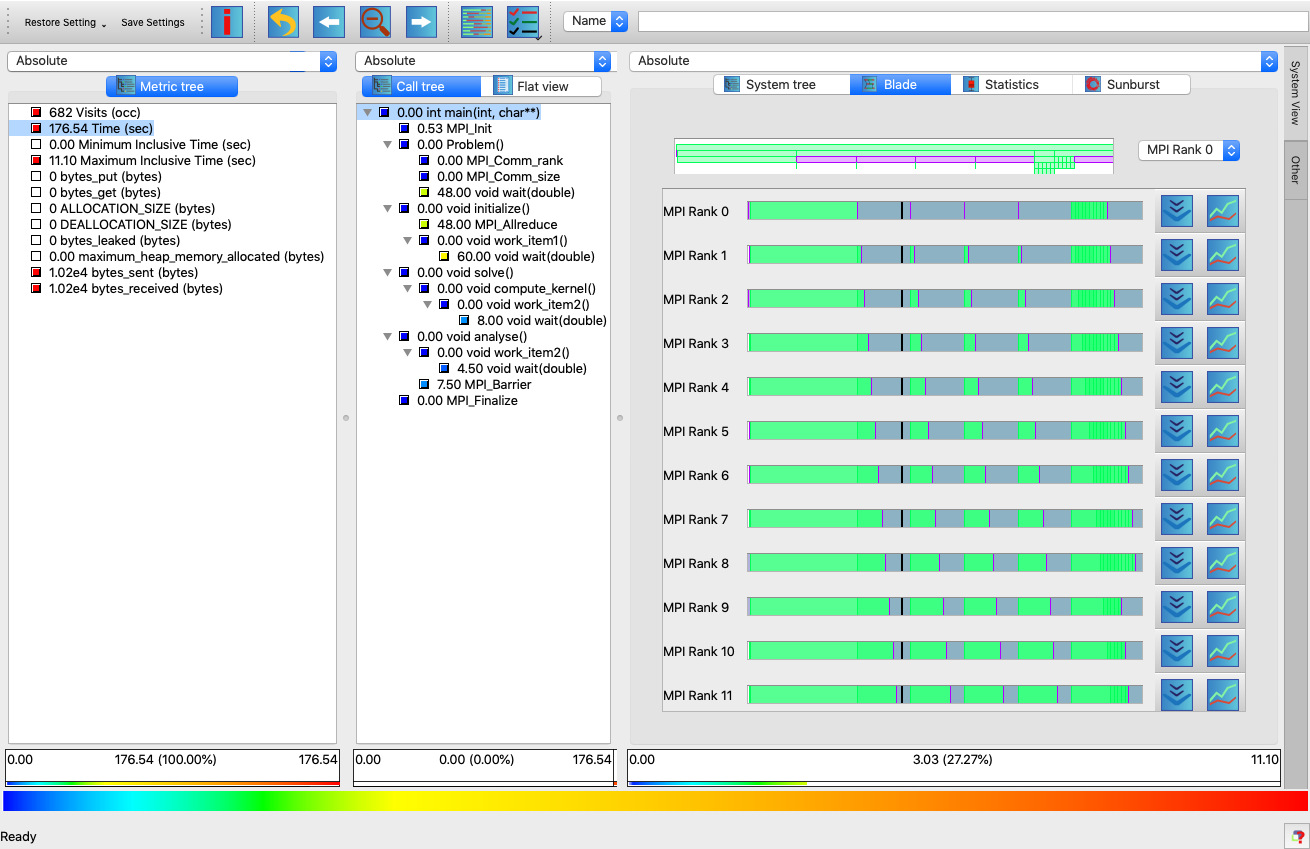
Once the trace is loaded, trace visualiser is ready:
There is no documentation about Blade plugin in the Cube User Guide v4.4. Here are some points to note:
- At the top of system pane, Name text box allows to filter functions.
- Process specific timeline view is shown at the beginning. It helps to understand overall execution timeline of specific rank.
- Timeline viewer also shows call-stack at specific time (on mouse-over).
- Trace viewer is updated as we select the function node in Call tree Pane.
You can inspect call-stack at specific time or zoom into region of interest. Here is the full demo showing some of the above aspects with the toy example described before:
Blade plugin is not full fledged trace visualiser (like Vampir) but does good job for common scenarios. I tried to use it with our one of the production application with 256 MPI processes generating ~300MB of trace and it worked well. To get best out of it, make sure to reduce the trace size using selective instrumentation or filtering mechanisms described in Score-P User Guide.
That's all for this post.
CREDIT
Thanks to Scalasca and Cube Developer Team for putting together this wonderful tool!