Different python profiling tools use different methodologies for gathering performance data and hence have different runtime overhead. Before choosing a profiler tool it is helpful to understand two commonly employed techniques for collecting performance data :
- Deterministic profiling Deterministic profilers execute trace functions at various points of interest (e.g. function call, function return) and record precise timings of these events. Typically this requires source code instrumentation but python provides hooks (optional callbacks) which can be used to insert trace functions.
- Statistical profiling Instead of tracking every event (e.g. call to every function), statistical profilers interrupt application periodically and collect samples of the execution state (call stack snapshots). The call stacks are then analysed to determine execution time of different parts of the application.
There are several deterministic profilers available based on built-in modules like profile and cProfile. These profilers can gather high-resolution profiling information but often there is one main drawback : high overhead. If the application has large number of function calls, you can imagine that the profiler will end up collecting lots of record. And if these functions are small, their execution time could be inaccurate due to overhead from measurement itself.
If we are developing small applications or debugging on workstation, this overhead is ok. But in production environment we do not want to use such tools if there is a noticeable performance impact. This is where statistical profilers come to rescue. These profilers samples the effective instruction pointer to determine where the execution time is spent. Also, one can adjust the sampling interval as needed : set sampling resolution very low for non-interesting part of the application and increase it only when you need high resolution profiling data. This is very helpful in production environment where you can dynamically adjust the profiling settings.
Consider below toy example with call chain :
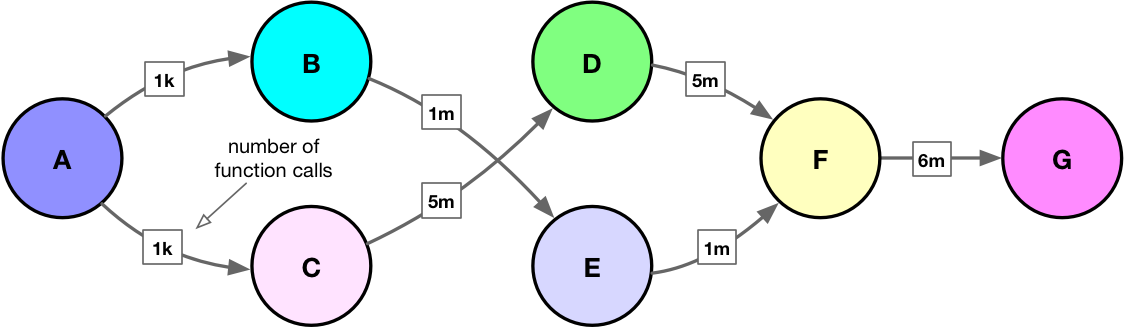
And here is sample code (for demonstration only):
|
1 2 3 4 5 6 7 8 9 10 11 12 13 14 15 16 17 18 19 20 21 22 23 24 25 26 27 28 29 30 31 32 |
from math import exp import timeit def A(): for i in range(1000): B(1, 279.17) for i in range(1000): C(1, 279.17) def B(a, b): for i in range(1000): E(a, b) def C(a, b): for i in range(5000): D(a, b) def D(a, b): F(a, b) def E(a, b): F(a, b) def F(a, b): G(a, b) def G(a, b): c = a + exp(b) print ('Execution time : %.2f sec' % (timeit.timeit(A, number=1))) |
If we run above example without any profiler, it takes ~1.8 seconds on my workstation:
|
1 2 3 4 |
$ python 01_sample/sample.py Execution time : 1.81 sec |
When we run the same example under cProfile, the execution time increases to ~4.5 seconds :
|
1 2 3 4 5 6 7 8 9 10 11 12 13 14 15 16 17 18 19 |
$ python -m cProfile -s cumtime sample.py Execution time : 4.53 sec 24004023 function calls in 4.530 seconds Ordered by: cumulative time ncalls tottime percall cumtime percall filename:lineno(function) 1 0.000 0.000 4.530 4.530 sample.py:1(<module>) ... 1 0.001 0.001 4.530 4.530 sample.py:4(A) 1000 0.632 0.001 3.644 0.004 sample.py:14(C) 5000000 0.885 0.000 2.994 0.000 sample.py:18(D) 6000000 1.076 0.000 2.622 0.000 sample.py:24(F) 6000000 1.100 0.000 1.545 0.000 sample.py:27(G) 1000 0.157 0.000 0.885 0.001 sample.py:10(B) 1000000 0.212 0.000 0.724 0.000 sample.py:21(E) ... |
So there is roughly 2.5x slowdown. Instead of cProfile if we use sampling profiler like PyFlame, Py-Spy or Plop, we see :
|
1 2 3 4 5 6 7 8 9 10 11 12 13 14 |
$ pyflame --rate=0.005 -o profile.txt -t python sample.py Execution time : 1.97 sec $ sudo py-spy --flame profile.svg --dump --function --rate 200 --duration 5 --nonblocking -- python sample.py Sampling process 200 times a second for 5 seconds Wrote flame graph 'profile.svg'. Samples: 370 Execution time : 1.85 sec → python -m plop.collector --interval 0.005 --format=flamegraph sample.py Execution time : 1.94 sec profile output saved to profiles/sample.py-20190119-1541-56.flame ... |
With these sampling profilers the overhead is considerably low (~ 10%). And this is why for large, complex applications in production environment the sampling profilers are more interesting. Read more about this on Uber blog.
Here is flamegraph produced from Py-Flame :
And this one from Py-Spy :
If you are wondering about different profiling tools available for python applications, here is short list : cProfile, PyCallGraph, RunSnakeRun, vprof, line_profiler, What Studio Profiling, PyFlame, plop, pprofile, StackImpact Python Profiler, Py-Spy, memory_profiler, vmprof, Pyinstrument, Python-Flamegraph, PyVmMonitor
Similar to Summary of Profiling Tools For Parallel Applications, comprehensive summary of 30 different python profilers will follow soon!