Saturday, 23rd Sept 2023: I've been curiously staring at my blog for quite some time, and it reminds me over and over again that it's been nearly two years since I managed to write new content here 😞. I have a few work-in-progress articles, and unfortunately, they've remained incomplete for quite some time. It's been a bit challenging to find dedicated long weekend hours to write the detailed posts that I really love. But "not having enough time" most likely is just another excuse and a form of procrastination.
So, I've decided to try a different strategy: instead of attempting to write long and detailed posts that need multiple weekends, I will write multiple shorter ones that I can easily complete over a weekend. Still revolving around the same theme of performance engineering topics and tools that I love!
Let's see how this strategy unfolds in the coming months...🚀
Background
A brief background on why we are keenly interested in measuring core-to-core latency and how a tool like this is helpful.
NUMA
In the previous article on LIKWID, there is a sufficiently detailed discussion of the Non-Uniform Memory Access (NUMA) architectural aspects, see the sections titled "II. Brief Overview of CPU Architecture" and "13. NUMA Effect: How to measure the performance impact?". In summary, NUMA architecture allows processors to access the memory attached to the same socket, as well as the memory on all other sockets within a given compute node. However, accessing local memory on each socket is faster than accessing memory on a remote socket due to the inter-socket link.
We can use tools such as numactl to examine the distance matrix between NUMA nodes or domains:
|
1 2 3 4 5 6 7 8 9 10 |
$ numactl -H available: 2 nodes (0-1) node 0 cpus: 0 1 2 3 ... node 1 cpus: 20 21 22 ... node distances: node 0 1 0: 10 21 1: 21 10 |
The same can be also seen from thesysfs:
|
1 2 3 4 5 |
$ cat /sys/devices/system/node/node*/distance 10 21 21 10 |
The above example is of a compute node with two Cascade Lake 6248 CPUs (20 physical cores each). The memory latency distances in the same NUMA domain/node is normalized to 10 (1.0x). The distances between other NUMA domains in the node are scaled relative to this base value of 10. For example, the value 21 represents the 2.1x latency difference when NUMA node 0 accesses remote memory from NUMA node 1 vs. NUMA node 0 accessing local memory on the same NUMA node 0.
We commonly use memory benchmarks like STREAM to understand certain aspects like achievable memory bandwidth (with a single core, multiple cores, NUMA effects, etc.) but they do not easily help to understand other architectural aspects like the interplay between cache hierarchies of different cores.
Cache Coherency and Core-to-Core Latencies
The inter-socket links like Quick Path Interconnect (QPI) provide point-to-point connectivity to other processors but introduce a new challenge of keeping a uniform memory view among all the processors. To address this, the Cache Coherent NUMA (CC-NUMA) systems use inter-processor communication to keep a consistent view of memory when the same memory location is stored or manipulated in caches of different processors.
The complexity of modern memory subsystems with multiple cache levels imposes a substantial overhead in maintaining cache coherence within shared memory systems. Consequently, when multiple cores attempt to access or modify the same memory location in rapid succession, particularly when cache lines are in different coherency states, it can result in significant memory access latency and hence poor performance. Hence, a quick and easy latency measurement tool is useful to know!
Enter "core-to-core-latency" Tool
There are various other tools to measure the metrics like cores to cores latencies. Recently I came across core-to-core-latency tool written by Nicolas Viennot. Even though it's a small utility tool, it's simple and generates a nice and easy-to-read latency heatmap plot. So I thought this is a perfect candidate for a short blog post!
Install
The tool is written in Rust and can be easily installed using the cargo package manager. While I do not have prior experience with Rust, setting it up appears to be a straightforward process:
|
1 2 3 4 5 6 7 8 |
$ curl https://sh.rustup.rs -sSf | sh ... Rust is installed now. Great! ... To configure your current shell, run: source "$HOME/.cargo/env" |
Configure the shell as suggested and use cargo command to install the tool:
|
1 2 3 4 5 6 7 8 9 |
$ cargo install core-to-core-latency Updating crates.io index Downloaded core-to-core-latency v1.2.0 ... Installing /home/kumbhar/.cargo/bin/core-to-core-latency Installed package <code>core-to-core-latency v1.2.0</code> (executable <code>core-to-core-latency</code>) |
Use
The CLI options are not exhaustive and straighforward:
|
1 2 3 4 5 6 7 8 9 10 11 12 13 14 15 16 17 18 19 20 21 |
$ core-to-core-latency --help USAGE: core-to-core-latency [OPTIONS] [ARGS] ARGS: <NUM_ITERATIONS> The number of iterations per sample [default: 1000] <NUM_SAMPLES> The number of samples [default: 300] OPTIONS: -b, --bench <BENCH> Select which benchmark to run, in a comma delimited list, e.g., '1,3' 1: CAS latency on a single shared cache line. 2: Single-writer single-reader latency on two shared cache lines. 3: One writer and one reader on many cache line, using the clock. [default: 1] -c, --cores <CORES> Specify the cores by id that should be used, comma delimited. By default all cores are used --csv Outputs the mean latencies in CSV format on stdout -h, --help Print help information |
We will use the benchmark that performs Compare-And-Swap (CAS) operation between the cores of the same socket and cores of different sockets. We will continue using the dual-socket Cascade Lake 6248 CPU as before:
|
1 2 3 4 5 6 7 8 9 10 11 12 13 14 15 16 17 18 19 20 21 22 23 |
$ core-to-core-latency 5000 --cores=0,1,2,3,20,21,22,23 CPU: Intel(R) Xeon(R) Gold 6248 CPU @ 2.50GHz Num cores: 8 Num iterations per samples: 5000 Num samples: 300 1) CAS latency on a single shared cache line 0 1 2 3 20 21 22 23 0 1 51±0 2 50±0 50±0 3 48±0 47±0 47±0 20 151±0 150±0 149±0 147±0 21 150±0 150±0 149±0 147±0 51±0 22 149±0 148±0 147±0 145±0 50±0 50±0 23 147±0 147±0 146±0 144±0 48±0 47±0 47±0 Min latency: 47.1ns ±0.0 cores: (3,2) Max latency: 150.6ns ±0.0 cores: (20,0) Mean latency: 105.3ns |
Understanding the output is straightforward: Cores 0-3 belong to the first socket, while cores 20-23 are part of the second socket. CAS operation latencies on the same socket are approximately 50ns, but when cores from different sockets are involved, the latency increases to around 150ns. I tried quickly to cross-check these figures with Intel's Memory Latency Checker tool, but I'll delve into that later. (Otherwise, this post could become long and I will find myself in a perpetual waiting cycle!). Anyway, if you curious and want to see previous questions, take a quick look at the GitHub issues.
Let's produce a few more results for different configurations and produce few nice plots:
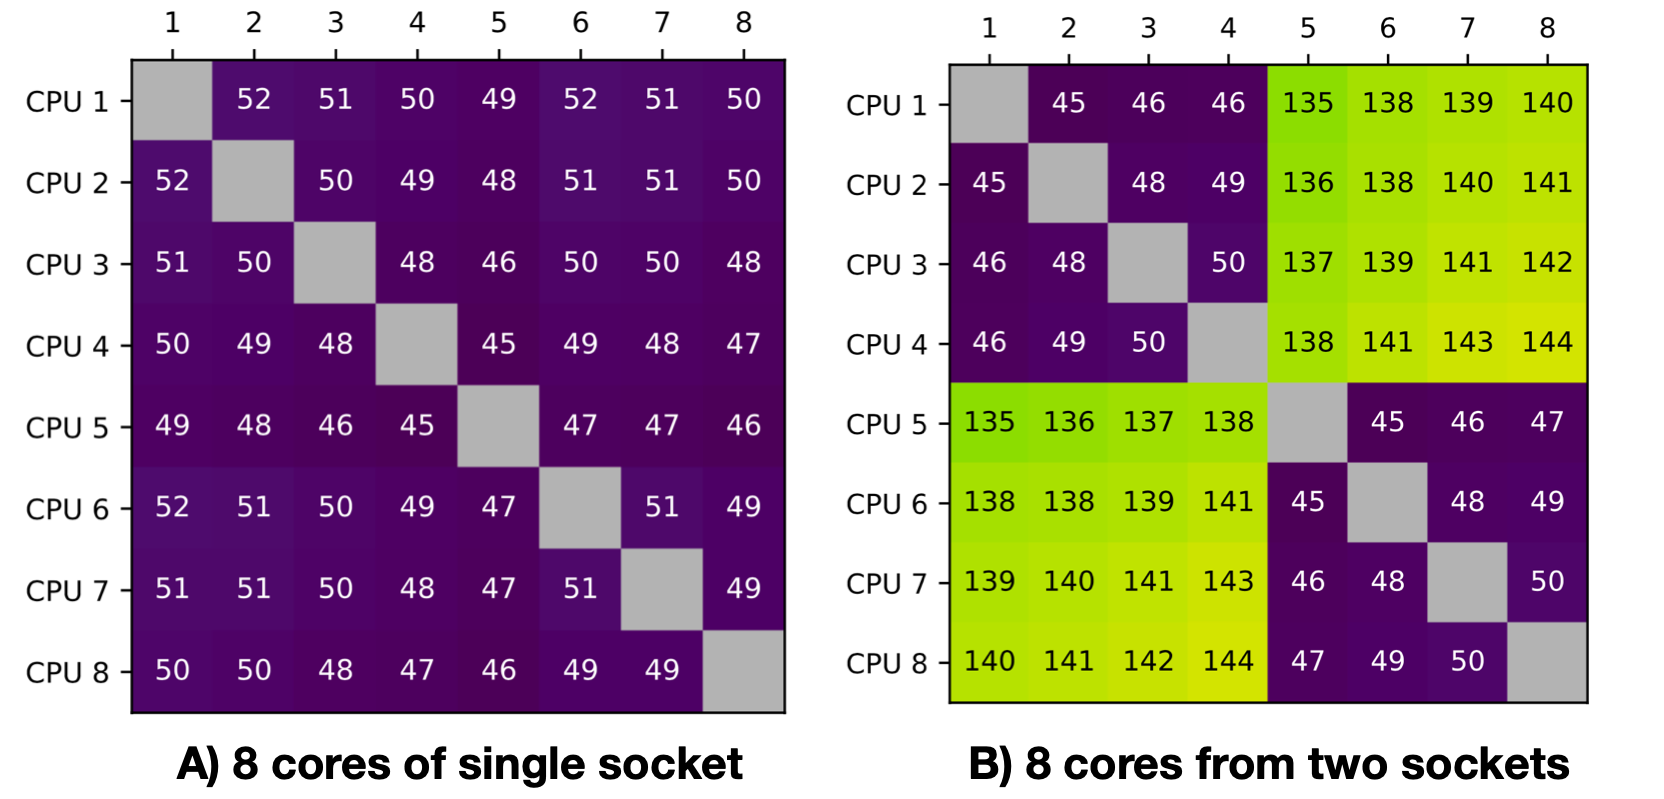
- A) Utilizing all 8 cores of the first socket
- B) Allocating 4 cores from the first socket and another 4 cores from the second socket
- C) Utilizing the full node, which comprises 20 cores from the first socket and 20 cores from the second socket
|
1 2 3 4 5 |
$ core-to-core-latency 5000 --cores=0,1,2,3,4,5,6,7 --csv > clx-6248-same-socket-8c.csv $ core-to-core-latency 5000 --cores=0,1,2,3,20,21,22,23 --csv > clx-6248-diff-socket-8c.csv $ core-to-core-latency 5000 --csv --cores=0,1,2,3,4,5,6,7,8,9,10,11,12,13,14,15,16,17,18,19,20,21,22,23,24,25,26,27,28,29,30,31,32,33,34,35,36,37,38,39 > clx-6248.csv |
Now, we can take the generated CSV reports and integrate them into the notebook, which will generate the latency heatmap plots as follows:
and 3rd configuration of all 40 cores from two different sockets:
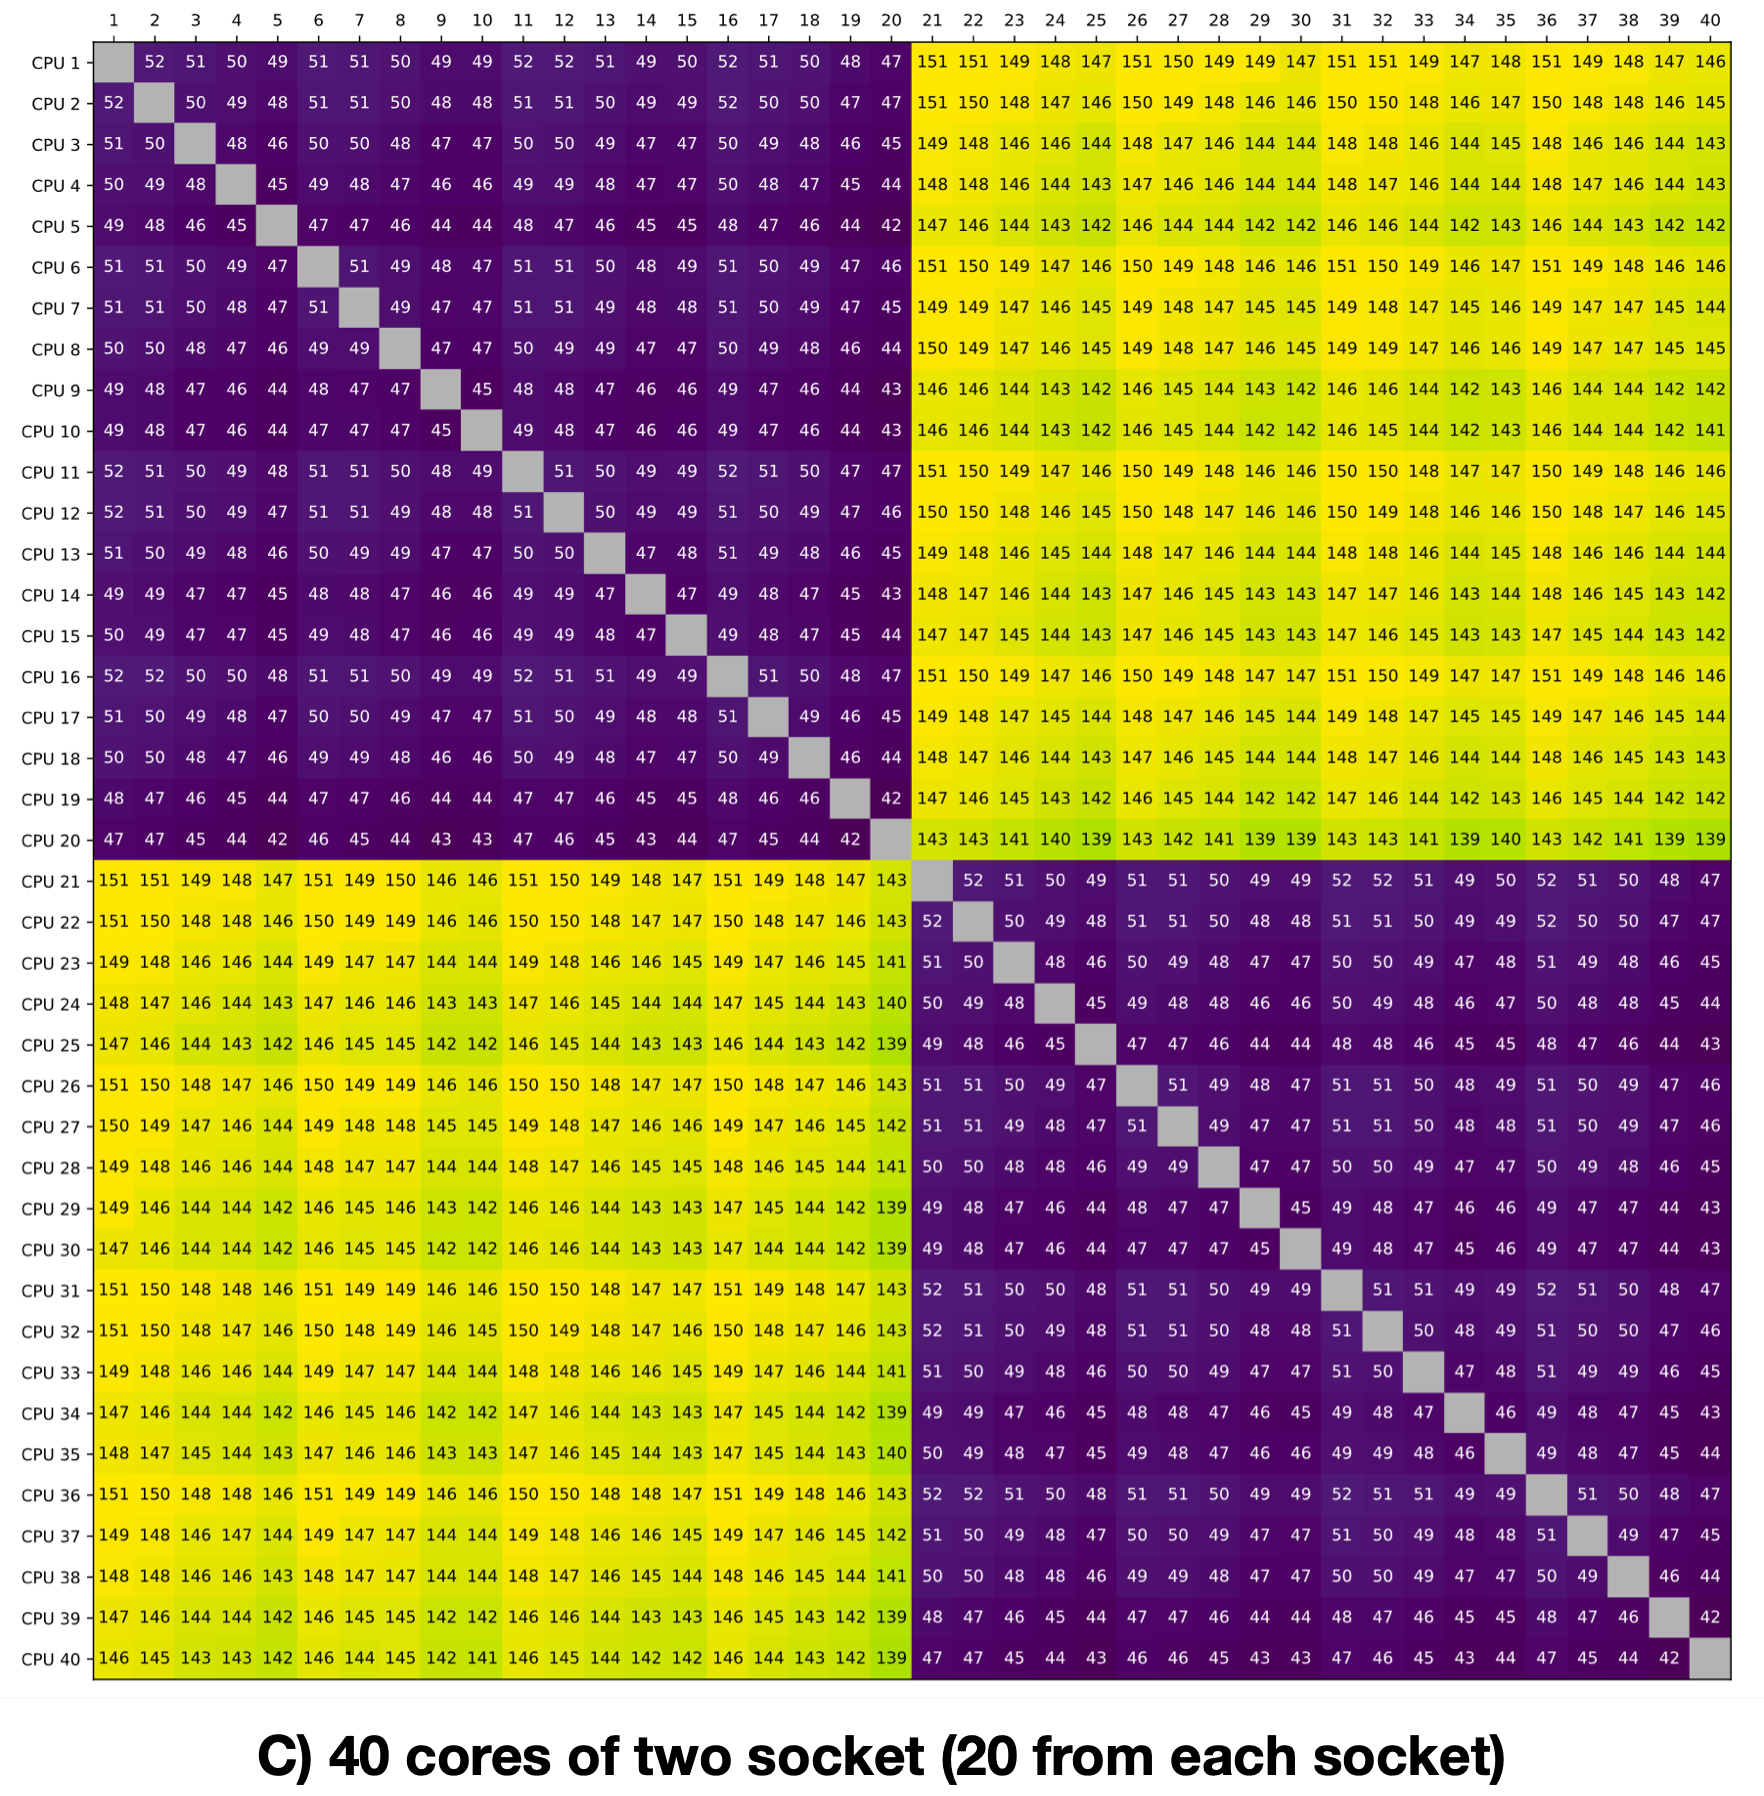
Aren't these plots self-explanatory? Love to see when performance tools present data in an intuitive manner, aligning with our mental models! Feel free to explore the tool further.
That's all for today! I think this short post gives sufficient background about the tool, allowing me to wrap up this short post on the same weekend! 🚀
Credit
All credit goes to Nicolas Viennot who has put together this tool and made it available on GitHub Repo. Thanks, Nicolas!